| Description | A step by step guide to start on R |
|---|---|
| Authors | christine Tranchant-Dubreuil (christine.tranchant@ird.fr) |
| Creation Date | 21/09/2018 |
| Last Modified Date | 22/09/2018 |
Summary
- Starting slowly on R
- Importing Data From
csvFile Into aDataframe- Storing the content of a file allGenomeVersion.csv into a dataframe myGenome -
read.csv2()(french format) - Displaying the whole dataframe
- Getting the type -
class(dataframe) - Getting the structure of the dataframe (data type, number of levels) -
str(dataframe) - Getting basic stats about te content of a dataframe -
summary(dataframe)
- Storing the content of a file allGenomeVersion.csv into a dataframe myGenome -
- Displaying basic informations about the dataframe structure
- Displaying the dataframe content
- Printing the first lines -
head(dataframe) - Printing the last lines -
last(dataframe) - Printing a column -
dataframe[colNum|colName]ordataframe$colName - Printing one whole line -
dataframe[lineNum,] - Printing one line, one column -
dataframe[lineNum,colNum] - Printing some lines -
dataframe[LineStart:LineEnd,] - Printing one column of some lines -
dataframe[c(line1,line2,line3),colNum]
- Printing the first lines -
- Manipulating the content of a dataframe
- Adding a new column
- Extracting unique values of a column -
unique(dataframe$colName) - Extracting one part of a dataframe -
subset(dataframe) - Calculating a sum -
sum(dataframe)with filtering on an other column - Getting the number of elements in a dataframe -
length(dataframe)with filtering on an other column - Ordering dataframe on one column
- Getting summaries of values of a column -
summary
- Plotting data from a dataframe with
ggplotlibrary - License
Starting slowly on R
Installing New Packages/libraries - install.packages(package)
>install.packages('ggplot2')Loading libraries - library(package)
>library(ggplot2) # plot
>library(scales)  # plot scales
>library(stringr) # str_detect
>library(gridExtra) # grid`
Setting a Working Directory setwd(path)
>setwd(/users/tranchan/riceAnalysis)Getting the current Working Directory getwd()
>getwd()
[1] "/Users/tranchan/Documents/Bioanalyse/panGenome"
Importing Data From csv File Into a Dataframe
Storing a file allGenomeVersion.csv into the dataframe myGenome - read.csv2() (french format)
#File with 6 columns and 2010 lines
Name	Type	Length	%GC	Organism	Type
Chr01	N	32613412	43.53	dna:chromosome	v1
Chr01	N	39656875	43.05	dna:chromosome	v2
Chr02	N	29142869	43.19	dna:chromosome	v1
Chr02	N	34451706	42.81	dna:chromosome	v2
Chr03	N	33053699	43.20	dna:chromosome	v1
Chr03	N	35526804	43.23	dna:chromosome	v2
Chr04	N	26299011	43.54	dna:chromosome	v1
Chr04	N	31572834	43.19	dna:chromosome	v2
Chr05	N	23192814	42.91	dna:chromosome	v1
Chr05	N	26274045	42.82	dna:chromosome	v2
Chr06	N	24174485	42.90	dna:chromosome	v1
Chr06	N	29275208	42.90	dna:chromosome	v2
Chr07	N	21799424	43.09	dna:chromosome	v1
Chr07	N	26599614	42.82	dna:chromosome	v2
Chr08	N	20292731	42.97	dna:chromosome	v1
Chr08	N	25472747	42.64	dna:chromosome	v2
Chr09	N	17607432	43.51	dna:chromosome	v1
Chr09	N	21796211	42.91	dna:chromosome	v2
Chr10	N	16910673	43.10	dna:chromosome	v1
Chr10	N	22418184	42.96	dna:chromosome	v2
Chr11	N	20796451	42.59	dna:chromosome	v1
Chr11	N	26393634	42.28	dna:chromosome	v2
Chr12	N	19154523	42.47	dna:chromosome	v1
Chr12	N	25020143	42.38	dna:chromosome	v2
ADWL01002872.1	N	9871	37.93	dna:scaffold	v1
ADWL01002880.1	N	2202	52.91	dna:scaffold	v1
ADWL01002881.1	N	2284	63.09	dna:scaffold	v1
....>myGenome <- read.csv2("allGenomeVersion.csv",header = TRUE)Displaying the whole dataframe
>myGenome

Name  Type  Length  X.GC  Organism  Type.1
Chr10	N	16910673	43.10	dna:chromosome	v1
Chr09	N	17607432	43.51	dna:chromosome	v1
Chr12	N	19154523	42.47	dna:chromosome	v1
Chr08	N	20292731	42.97	dna:chromosome	v1
Chr11	N	20796451	42.59	dna:chromosome	v1
Chr07	N	21799424	43.09	dna:chromosome	v1
....
Get the type - class(dataframe)
>class(myGenome)
[1] "data.frame"
Get the structure of the dataframe (data type, number of levels) - str(dataframe)
>str(myGenome)
'data.frame':	2010 obs. of  6 variables:
 $ Name    : Factor w/ 1998 levels "ADWL01002872.1",..: 1210 1209 1212 1208 1211 1207 1205 1206 1204 1202 ...
 $ Type    : Factor w/ 1 level "N": 1 1 1 1 1 1 1 1 1 1 ...
 $ Length  : int  16910673 17607432 19154523 20292731 20796451 21799424 23192814 24174485 26299011 29142869 ...
 $ X.GC    : Factor w/ 1191 levels "26.08","30.70",..: 512 547 454 499 466 511 493 492 550 520 ...
 $ Organism: Factor w/ 2 levels "dna:chromosome",..: 1 1 1 1 1 1 1 1 1 1 ...
 $ Type.1  : Factor w/ 2 levels "v1","v2": 1 1 1 1 1 1 1 1 1 1 ...
Get basics stats about dataframe content - summary(dataframe)
>summary(myGenome)
      Name      Type         Length              X.GC                Organism    Type.1
 Chr01  :   2   N:2010   Min.   :    1026   44.90  :   7   dna:chromosome:  24   v1:1951
 Chr02  :   2            1st Qu.:    3229   41.27  :   6   dna:scaffold  :1986   v2:  59
 Chr03  :   2            Median :    5742   41.73  :   6
 Chr04  :   2            Mean   :  330219   42.82  :   6
 Chr05  :   2            3rd Qu.:   13154   42.91  :   6
 Chr06  :   2            Max.   :39656875   43.00  :   6
 (Other):1998                               (Other):1973
Displaying basic informations about the dataframe structure
Column names - names(dataframe) or colnames(dataframe)
> names(myGenome)
[1] "Name"     "Type"     "Length"   "X.GC"     "Organism" "Type.1"

> colnames(myGenome)
[1] "Name"     "Type"     "Length"   "X.GC"     "Organism" "Type.1"
Lines and columns number - dim(dataframe)
> dim(myGenome)
[1] 2010    6
Lines number - nrow(dataframe)
> nrow(myGenome)
[1] 2010
Columns number - ncol(dataframe)]
> ncol(myGenome)
[1] 6
Displaying and manipulating the dataframe content
Printing the first lines - head(dataframe)
> head(myGenome)
   Name Type   Length  X.GC       Organism Type.1
1 Chr10    N 16910673 43.10 dna:chromosome     v1
2 Chr09    N 17607432 43.51 dna:chromosome     v1
3 Chr12    N 19154523 42.47 dna:chromosome     v1
4 Chr08    N 20292731 42.97 dna:chromosome     v1
5 Chr11    N 20796451 42.59 dna:chromosome     v1
6 Chr07    N 21799424 43.09 dna:chromosome     v1

> head(myGenome,n=2)
   Name Type   Length  X.GC       Organism Type.1
1 Chr10    N 16910673 43.10 dna:chromosome     v1
2 Chr09    N 17607432 43.51 dna:chromosome     v1
Printing the last lines - last(dataframe)
> tail(myGenome)
            Name Type Length  X.GC     Organism Type.1
2005 ChrUN-Ctg78    N  21053 43.05 dna:scaffold     v2
2006 ChrUN-Ctg79    N  19363 40.63 dna:scaffold     v2
2007 ChrUN-Ctg80    N  15054 41.18 dna:scaffold     v2
2008 ChrUN-Ctg81    N  13998 42.98 dna:scaffold     v2
2009 ChrUN-Ctg82    N  13471 42.29 dna:scaffold     v2
2010 ChrUN-Ctg83    N  10534 42.37 dna:scaffold     v2

> tail(myGenome,n=1)
            Name Type Length  X.GC     Organism Type.1
2010 ChrUN-Ctg83    N  10534 42.37 dna:scaffold     v2
Printing a column - dataframe[colNum|colName] or dataframe$colName
- output result (line)
> head(myGenome[,"Length"])
[1] 16910673 17607432 19154523 20292731 20796451 21799424
> head(myGenome$Length)
[1] 16910673 17607432 19154523 20292731 20796451 21799424- output result (column)
> head(myGenome[1])
   Name
1 Chr10
2 Chr09
3 Chr12
4 Chr08
5 Chr11
6 Chr07
> head(myGenome['Length'])
Length
1 16910673
2 17607432
3 19154523
4 20292731
5 20796451
6 21799424Printing one whole line - dataframe[lineNum,]
Line 2
> myGenome[2,]
   Name Type   Length  X.GC       Organism Type.1
2 Chr09    N 17607432 43.51 dna:chromosome     v1
Printing one line, one column - dataframe[lineNum,colNum]
Line 2, column 6 then line 2, column 3
> myGenome[2,6]
[1] v1
Levels: v1 v2

> myGenome[2,3]
[1] 17607432
Printing some lines - dataframe[LineStart:LineEnd,]
> myGenome[1:3,]
   Name Type   Length  X.GC       Organism Type.1
1 Chr10    N 16910673 43.10 dna:chromosome     v1
2 Chr09    N 17607432 43.51 dna:chromosome     v1
3 Chr12    N 19154523 42.47 dna:chromosome     v1

> myGenome[10:15,]
    Name Type   Length  X.GC       Organism Type.1
10 Chr02    N 29142869 43.19 dna:chromosome     v1
11 Chr01    N 32613412 43.53 dna:chromosome     v1
12 Chr03    N 33053699 43.20 dna:chromosome     v1
13 Chr01    N 39656875 43.05 dna:chromosome     v2
14 Chr02    N 34451706 42.81 dna:chromosome     v2
15 Chr03    N 35526804 43.23 dna:chromosome     v2
Printing one column of some lines - dataframe[c(line1,line2,line3),colNum]
Print the complete lines 1, 3, 7, 6 then just the column 3 of the same lines
> myGenome[c(1,3,7,6),]
   Name Type   Length  X.GC       Organism Type.1
1 Chr10    N 16910673 43.10 dna:chromosome     v1
3 Chr12    N 19154523 42.47 dna:chromosome     v1
7 Chr05    N 23192814 42.91 dna:chromosome     v1
6 Chr07    N 21799424 43.09 dna:chromosome     v1

> myGenome[c(1,3,7,6),3]
[1] 16910673 19154523 23192814 21799424
Manipulating the content of a dataframe
Adding a new column
- A new collumn firstly filled with “NA”
> myGenome["mb"] <- NA

> head(myGenome)
   Name Type   Length  X.GC       Organism Type.1 mb
1 Chr10    N 16910673 43.10 dna:chromosome     v1 NA
2 Chr09    N 17607432 43.51 dna:chromosome     v1 NA
3 Chr12    N 19154523 42.47 dna:chromosome     v1 NA
4 Chr08    N 20292731 42.97 dna:chromosome     v1 NA
5 Chr11    N 20796451 42.59 dna:chromosome     v1 NA
6 Chr07 N 21799424 43.09 dna:chromosome v1 NA- The new column receives the result of an operation
> myGenome$mb <- as.integer(myGenome$Length/1000000)

> head(myGenome)
   Name Type   Length  X.GC       Organism Type.1 mb
1 Chr10    N 16910673 43.10 dna:chromosome     v1 16
2 Chr09    N 17607432 43.51 dna:chromosome     v1 17
3 Chr12    N 19154523 42.47 dna:chromosome     v1 19
4 Chr08    N 20292731 42.97 dna:chromosome     v1 20
5 Chr11    N 20796451 42.59 dna:chromosome     v1 20
6 Chr07    N 21799424 43.09 dna:chromosome     v1 21
Extracting unique values of a column - unique(dataframe$colName)
> myGenome$Organism
   [1] dna:chromosome dna:chromosome dna:chromosome dna:chromosome dna:chromosome dna:chromosome dna:chromosome
   [8] dna:chromosome dna:chromosome dna:chromosome dna:chromosome dna:chromosome dna:chromosome dna:chromosome
  [15] dna:chromosome dna:chromosome dna:chromosome dna:chromosome dna:chromosome dna:chromosome dna:chromosome
  [22] dna:chromosome dna:chromosome dna:chromosome dna:scaffold   dna:scaffold   dna:scaffold   dna:scaffold
  [29] dna:scaffold   dna:scaffold   dna:scaffold   dna:scaffold   dna:scaffold   dna:scaffold   dna:scaffold
  [36] dna:scaffold   dna:scaffold   dna:scaffold   dna:scaffold   dna:scaffold   dna:scaffold   dna:scaffold
  [43] dna:scaffold   dna:scaffold   dna:scaffold   dna:scaffold   dna:scaffold   dna:scaffold   dna:scaffold
  [50] dna:scaffold   dna:scaffold   dna:scaffold   dna:scaffold   dna:scaffold   dna:scaffold   dna:scaffold
  [57] dna:scaffold   dna:scaffold   dna:scaffold   dna:scaffold   dna:scaffold   dna:scaffold   dna:scaffold
  [64] dna:scaffold   dna:scaffold   dna:scaffold   dna:scaffold   dna:scaffold   dna:scaffold   dna:scaffold
 ...
 [981] dna:scaffold   dna:scaffold   dna:scaffold   dna:scaffold   dna:scaffold   dna:scaffold   dna:scaffold
 [988] dna:scaffold   dna:scaffold   dna:scaffold   dna:scaffold   dna:scaffold   dna:scaffold   dna:scaffold
 [995] dna:scaffold   dna:scaffold   dna:scaffold   dna:scaffold   dna:scaffold   dna:scaffold
 [ reached getOption("max.print") -- omitted 1010 entries ]
Levels: dna:chromosome dna:scaffold

> unique(myRef$Organism)
[1] dna:chromosome dna:scaffold
Levels: dna:chromosome dna:scaffold

> unique(myGenomef$Type.1)
[1] v1 v2
Levels: v1 v2
Extracting one part of a dataframe into a new dataframe - subset(dataframe)
- Extract only lines about chromosome (Organism column equals to “dna:chromosome”) -
==
> myGenomeSubset <- subset(myGenome, Organism=="dna:chromosome")
> head(myrefGenome)

> myrefSubset <- subset(myGenome, Organism=="dna:chromosome")
> head(myrefGenome)
   Name Type   Length  X.GC       Organism Type.1 mb
1 Chr10    N 16910673 43.10 dna:chromosome     v1 16
2 Chr09    N 17607432 43.51 dna:chromosome     v1 17
3 Chr12    N 19154523 42.47 dna:chromosome     v1 19
4 Chr08    N 20292731 42.97 dna:chromosome     v1 20
5 Chr11    N 20796451 42.59 dna:chromosome     v1 20
6 Chr07    N 21799424 43.09 dna:chromosome     v1 21

> dim(myRGenome)
[1] 2010    7

> dim(myGenomeSubset)
[1] 24 7- Extract only lines about scaffold (Organism column not equals to “dna:chromosome”) -
!=
> myScaffSubset <- subset(myRef, Organism!="dna:chromosome")

> head(myScaffSubset)
                  Name Type Length  X.GC     Organism Type.1 mb
25 Oglab05_unplaced019    N   1026 54.29 dna:scaffold     v1  0
26      ADWL01015058.1    N   1067 47.14 dna:scaffold     v1  0
27 Oglab04_unplaced014    N   1099 43.68 dna:scaffold     v1  0
28      ADWL01009716.1    N   1200 50.08 dna:scaffold     v1  0
29 Oglab04_unplaced051    N   1834 48.39 dna:scaffold     v1  0
30      ADWL01025219.1    N   2000 54.35 dna:scaffold     v1  0
Calculating a sum - sum(dataframe) with filtering on an other column
> sum(myGenomeSubset$Length)
[1] 629495529

> sum(myGenomeSubset$Length[myGenomeSubset$Type.1=="v1"])
[1] 285037524

> sum(myGenomeSubset$Length[myGenomeSubset$Type.1=="v2"])
[1] 344458005
Getting the number of elements in a dataframe - length(dataframe) with filtering on an other column
> length(myGenomeSubset$Length[myGenomeSubset$Type.1=="v1"])
[1] 1939

> sum(myGenomeSubset$Length[myGenomeSubset$Type.1=="v1"])
[1] 31382050

> length(myGenomeSubset$Length[myGenomeSubset$Type.1=="v2"])
[1] 47

> sum(myGenomeSubset$Length[myGenomeSubset$Type.1=="v2"])
[1] 2863041
Ordering dataframe on one column
myGenomeOrdered <- myGenomeSubset[order(myGenomeSubset$Name),]

> head(myGenomeOrdered)
    Name Type   Length  X.GC       Organism Type.1 mb
11 Chr01    N 32613412 43.53 dna:chromosome     v1 32
13 Chr01    N 39656875 43.05 dna:chromosome     v2 39
10 Chr02    N 29142869 43.19 dna:chromosome     v1 29
14 Chr02    N 34451706 42.81 dna:chromosome     v2 34
12 Chr03    N 33053699 43.20 dna:chromosome     v1 33
15 Chr03    N 35526804 43.23 dna:chromosome     v2 35
Getting summaries of values of a column - summary
> summary(mysSaffSubset$Length)
   Min. 1st Qu.  Median    Mean 3rd Qu.    Max.
   1026    3214    5613   17243   12601 1478587
Plotting data from a dataframe with ggplot library
To build a plot, the same following basic template can be used for several plot types :
ggplot(data = <DATA>, aes = (<MAPPINGS>)) + <GEOM_FUNCTION>()
- use the ggplot() function and bind the plot to a specific data frame using the
dataargument - use the
aesfunction to select the variables to be plotted and to define how tu present them in the graph (e.g. x/y positions, size, shape, color) - add ‘geoms’ – graphical representations of the data in the plot (points, lines, bars) such as
geom_point(),geom_boxplot(),geom_line(),geom-bar()
with ggplot() + geom_bar(stat = "identity")]
ggplot is a plotting package that makes simple to create complex plots from data stored in a data frame. It provides a programmatic interface for specifying what variables to plot, how they are displayed, and general visual properties.
https://datacarpentry.org/r-socialsci/04-ggplot2/
Creating a barplot with geom_bar(stat = "identity")]
Barplots are useful for visualizing categorical data. By default, geom_bar accepts a variable for x, and plots the number of instances each value of x (in this case, chromosome) appears in the dataset.
Here, we will :
- plot the size (mb) of each chromosome from each genome version with geom_bar
- use the fill aesthetic for the geom_bar() geom to color bars by the size of each chromosome for each genome version
- By default, geom_bar uses stat=”bin” to make the height of each bar equal to the number of cases in each group (it is incompatible with mapping values to the y aesthetic). Here we use
stat="identity"because we want the heights of the bars to represent values in the data (with a y aesthetic).
http://www.sthda.com/french/wiki/ggplot2-barplots-guide-de-demarrage-rapide-logiciel-r-et-visualisation-de-donnees#barplots-basiques
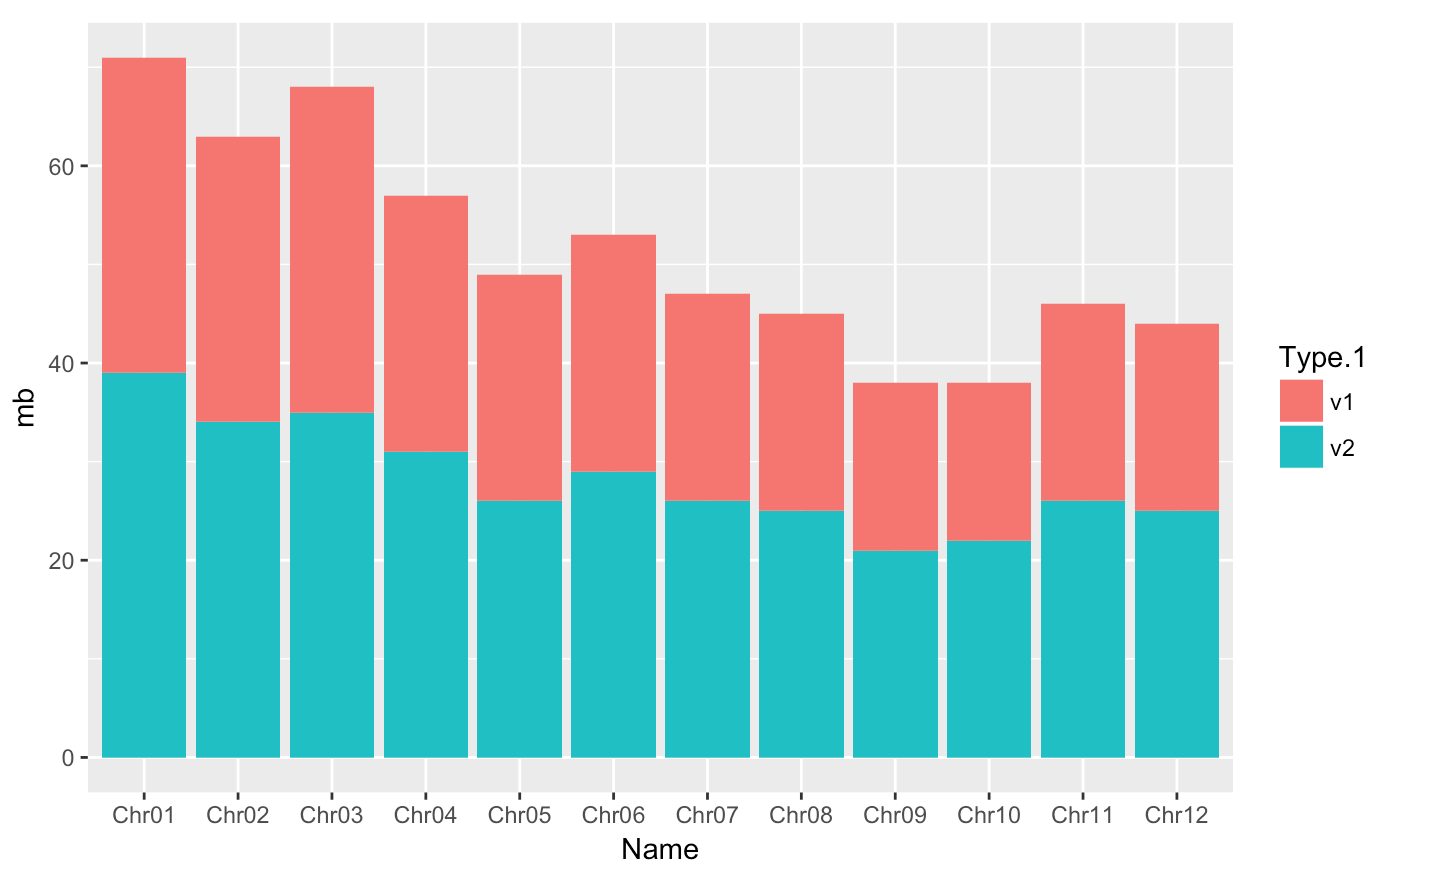
#basic barplot
p <- ggplot(data = myGenomeSubset, aes(x = Name, y=mb, fill=Type.1)) +
      geom_bar(stat = "identity")
p
distinct plot - position=position_dodge() and flip plot with coord_flip()
-
We can separate the portions of the stacked bar that correspond to each genome version and put them side-by-side by using the position argument for geom_bar() and setting it to “dodge”.
-
coord_flip(): Flip cartesian coordinates so that horizontal becomes vertical, and vertical, horizontal
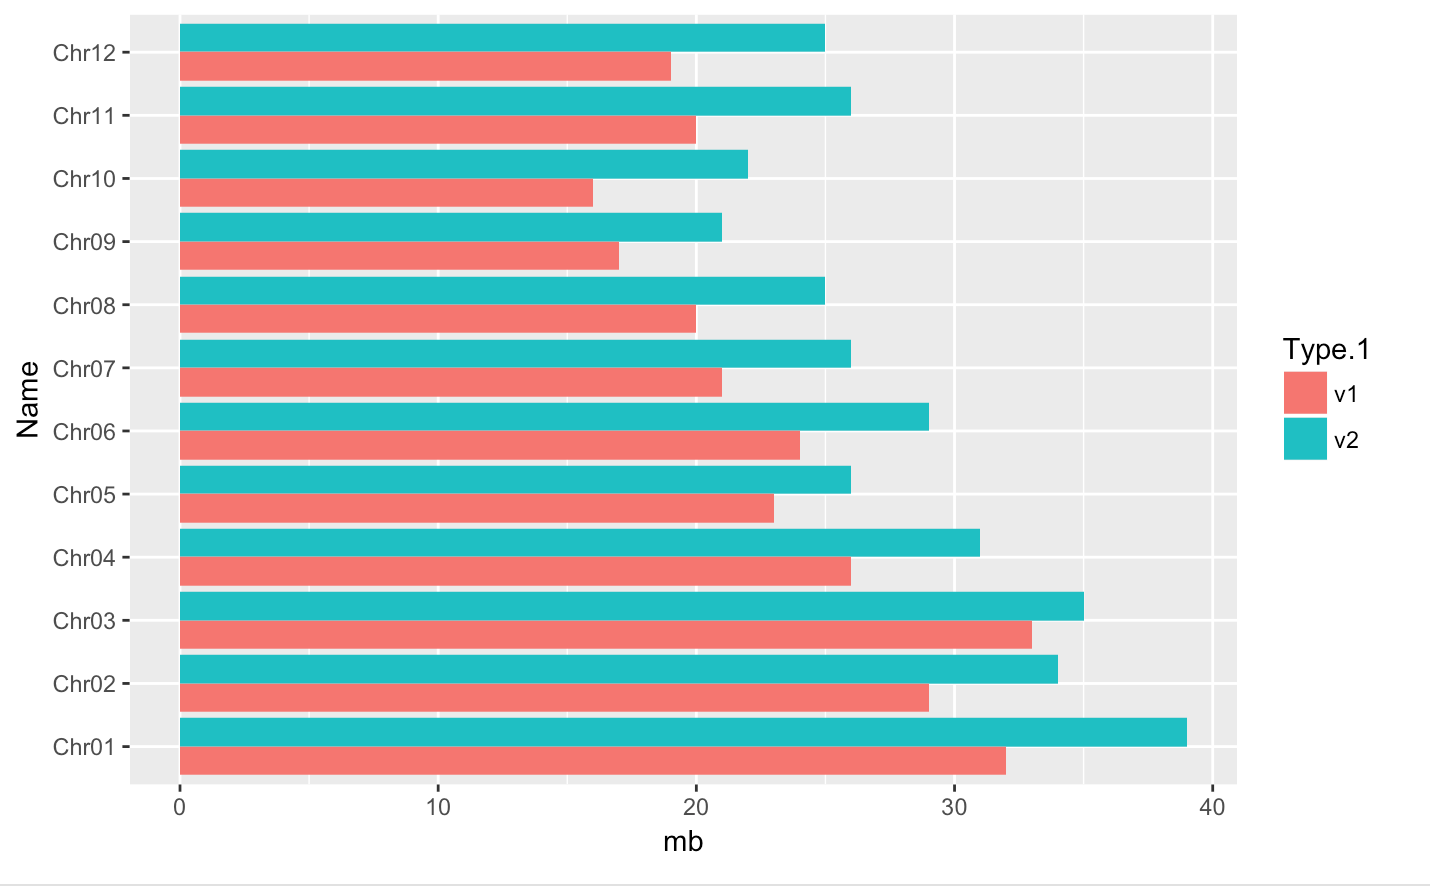
#basic barplot
q <- ggplot(data = myGenomeSubset, aes(x = Name, y=mb, fill=Type.1)) +
      geom_bar(stat = "identity", position=position_dodge())
#horizontal
q + coord_flip()
save into a file
jpeg(file="pseudomolOMAP.jpg");
#basic barplot
q <- ggplot(data = myGenomeSubset, aes(x = Name, y=mb, fill=Type.1)) +
      geom_bar(stat = "identity", position=position_dodge())
#horizontal
q + coord_flip()
dev.off;
Creating a barplot with geom_bar(stat = "count")]
- we use
stat="count"to make the height of each bar equal to the count of lines - Adding Labels and Titles with
ylab(<Y-LABEL>),xlab(<X-LABEL>),ggtitle(<TITLE-LABEL>)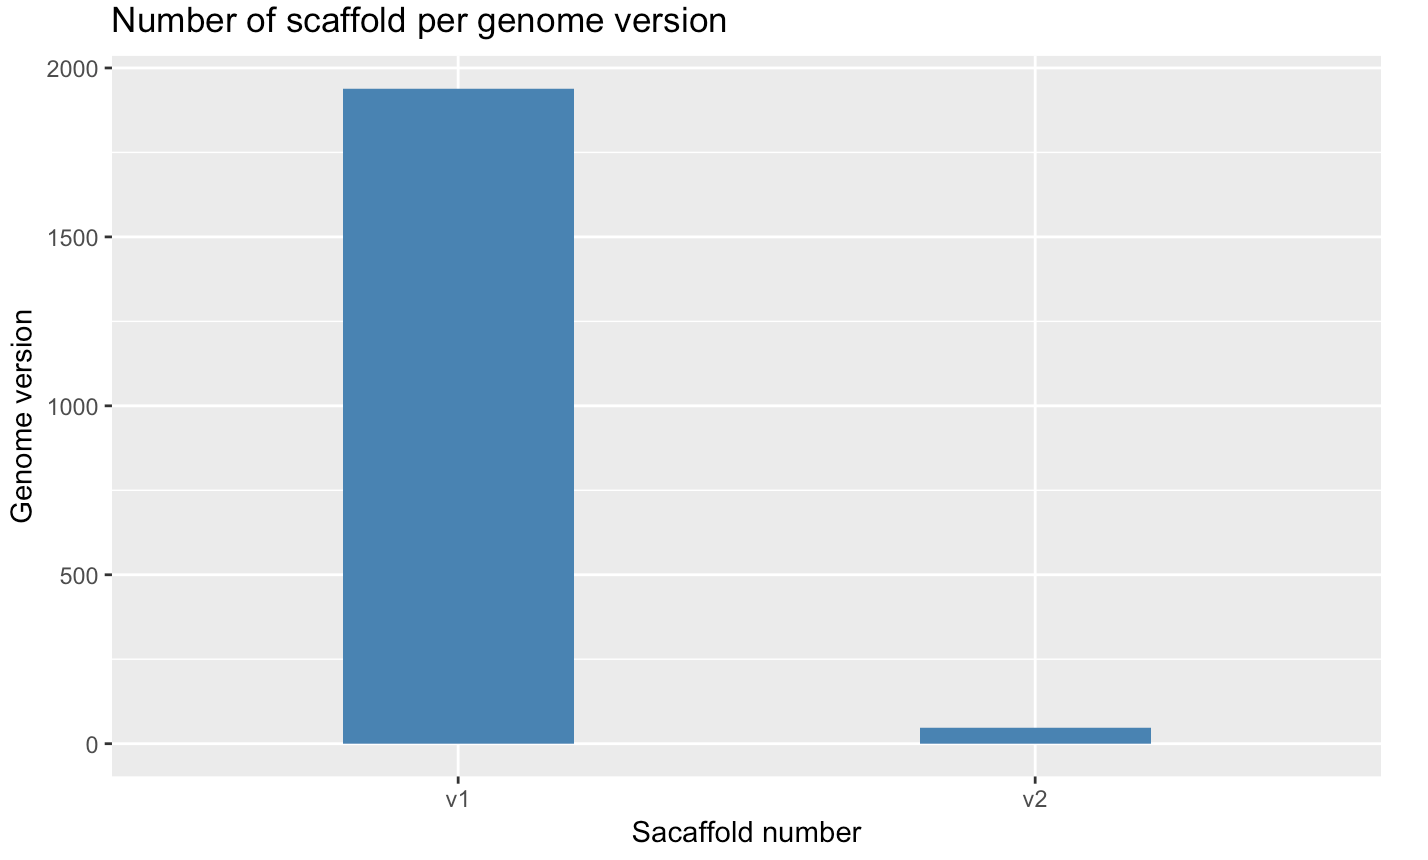
p <- ggplot(myscaffSubset, aes(x=Type.1)) + geom_bar(stat="count", width=0.4, fill="steelblue") +
    xlab("Genome version") +
    ylab("Scaffold number") +
    ggtitle("Number of scaffold per genome version")
p
Plotting a violin plot - geom_violin()
- Create a violin plot
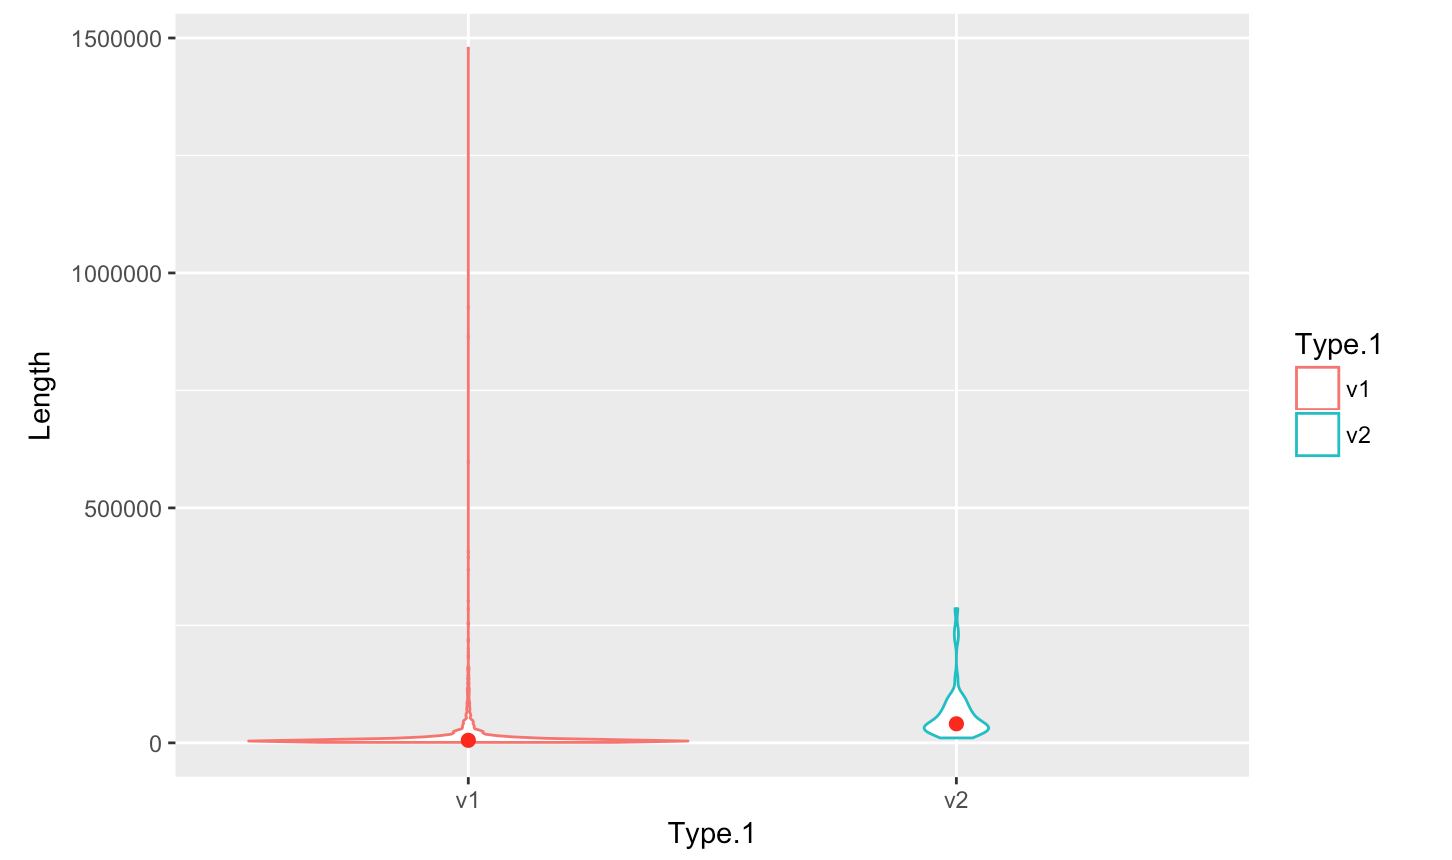
p <- ggplot(myScaffSubset, aes(x=Type.1, y=Length, color=Type.1)) +
+   geom_violin(trim=TRUE) + stat_summary(fun.y=median, geom="point", size=2, color="red")
> p- Save plot into a file
> jpeg(file="scaffoldOMAP.jpg");
> p <- ggplot(myScaffSubset, aes(x=Type.1, y=Length, color=Type.1)) +
+   geom_violin(trim=TRUE) + stat_summary(fun.y=median, geom="point", size=2, color="red")
> p
> dev.off;
Arranging plots in a grid - grid.arrange()
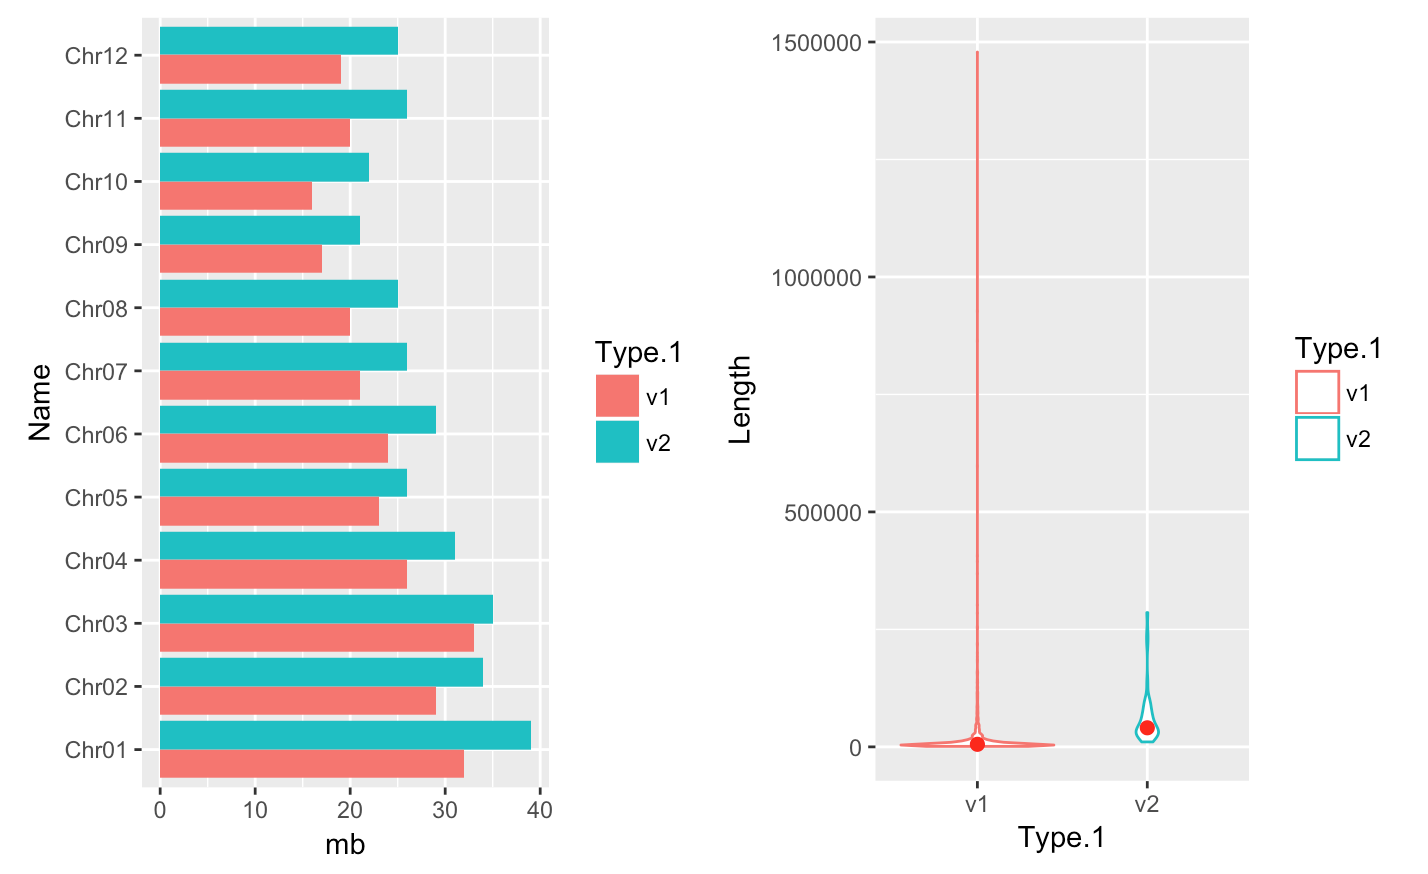
myplot1 <- ggplot(data = myGenomeSubset, aes(x = Name, y=mb, fill=Type.1)) +
      geom_bar(stat = "identity", position=position_dodge()) + coord_flip()

myplot2 <- ggplot(myScaffSubset, aes(x=Type.1, y=Length, color=Type.1)) +
  geom_violin(trim=TRUE) + stat_summary(fun.y=median, geom="point", size=2, color="red")

grid.arrange(myplot1, myplot2, ncol=2)
Displaying and manipulating the dataframe content
Printing the first lines - head(dataframe)
License

